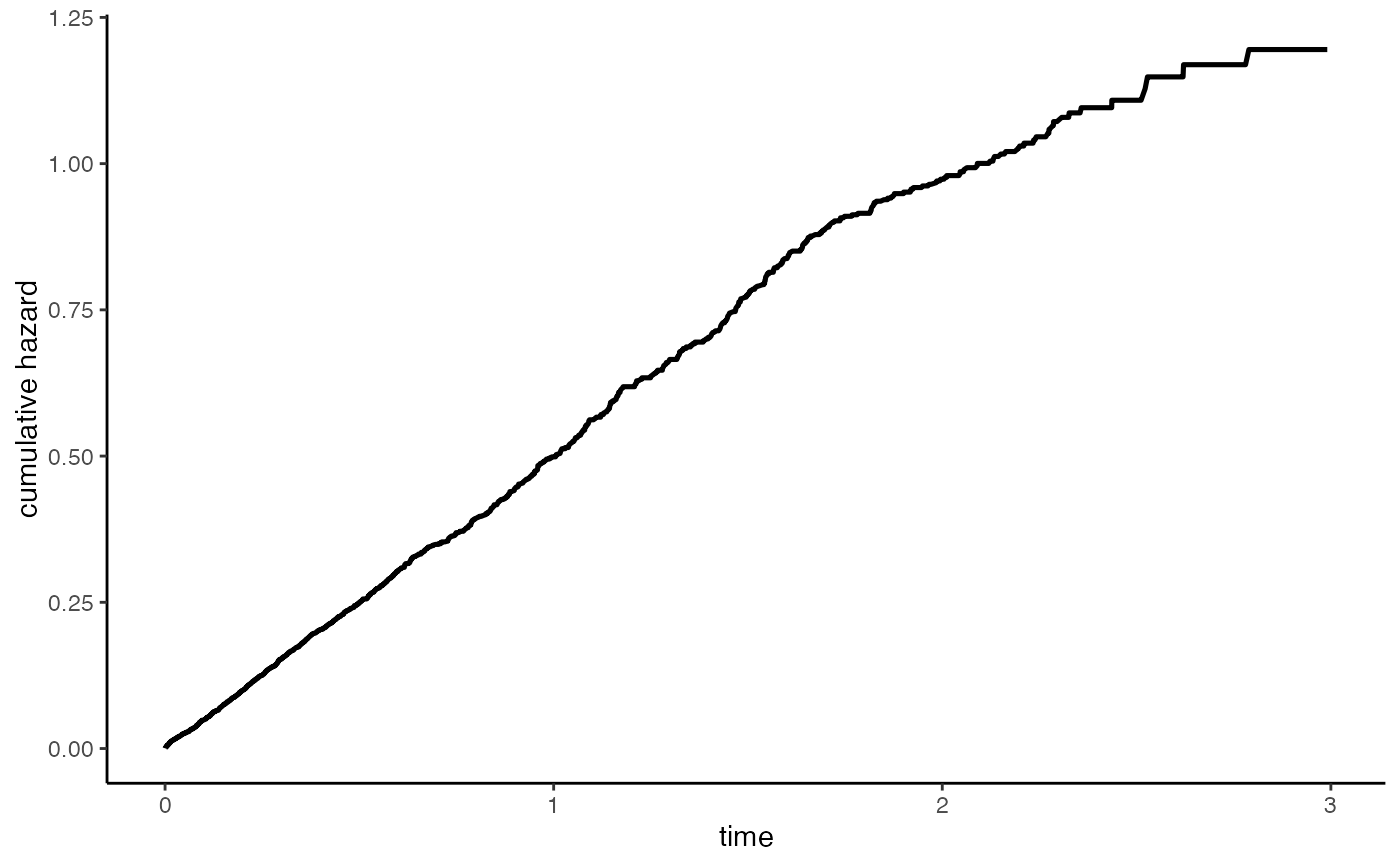
Plotting the baseline hazard from a fitted baseline object.
# S3 method for baseline
plot(x, xlab, ylab, xlim, ylim, title, ...)
Arguments
- x
fitted object from
baselinefunction.- xlab
the title for the x axis.
- ylab
the title for the y axis.
- xlim
the limits of the x axis.
- ylim
the limits of the y axis.
- title
the title for the plot.
- ...
other graphical parameters to plot
Examples
data(ExampleData)
z <- ExampleData$z
time  <- ExampleData$time
event <- ExampleData$event

fit   <- coxtv(event = event, z = z, time = time)
#> Iter 1: Obj fun = -3.2982771; Stopping crit = 1.0000000e+00;
#> Iter 2: Obj fun = -3.2916285; Stopping crit = 2.1424865e-02;
#> Iter 3: Obj fun = -3.2916034; Stopping crit = 8.0884492e-05;
#> Iter 4: Obj fun = -3.2916034; Stopping crit = 1.8232153e-09;
#> Algorithm converged after 4 iterations!
base.est <- baseline(fit)
plot(base.est)
