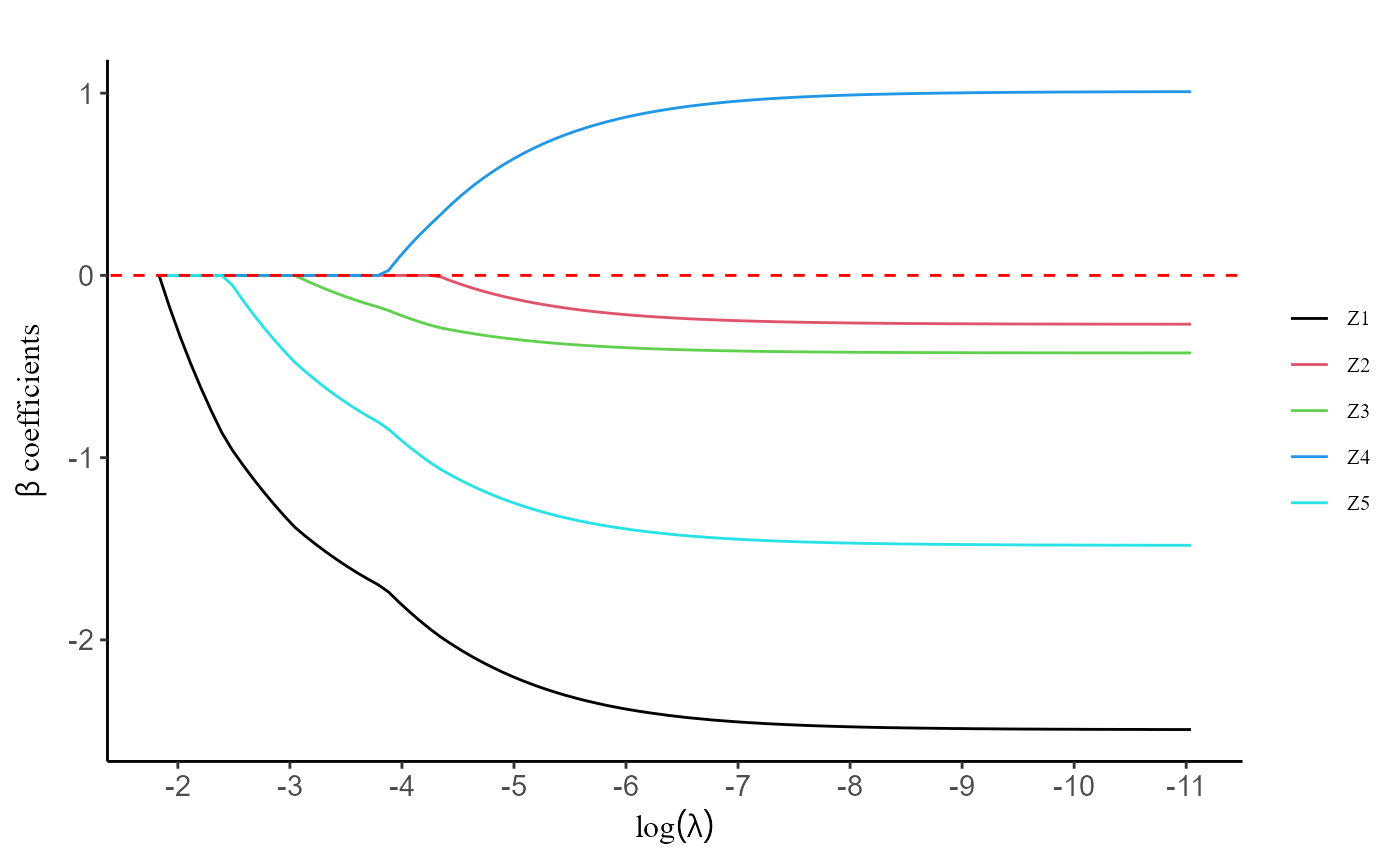
Plot regularization path of coefficients from a ppDiscSurv object
Source:R/plot.path.ppDiscsurv.R
plot.ppDiscSurv.RdReturn the plot the regularization path from a ppDiscSurv object
Usage
# S3 method for class 'ppDiscSurv'
plot(fit, log.x = T, label = F)Examples
data(DiscTime)
data <- DiscTime$data
Event.char <- DiscTime$Event.char
prov.char <- DiscTime$prov.char
Z.char <- DiscTime$Z.char
Time.char <- DiscTime$Time.char
fit <- pp.DiscSurv(data, Event.char, prov.char, Z.char, Time.char)
plot(fit, label = T)