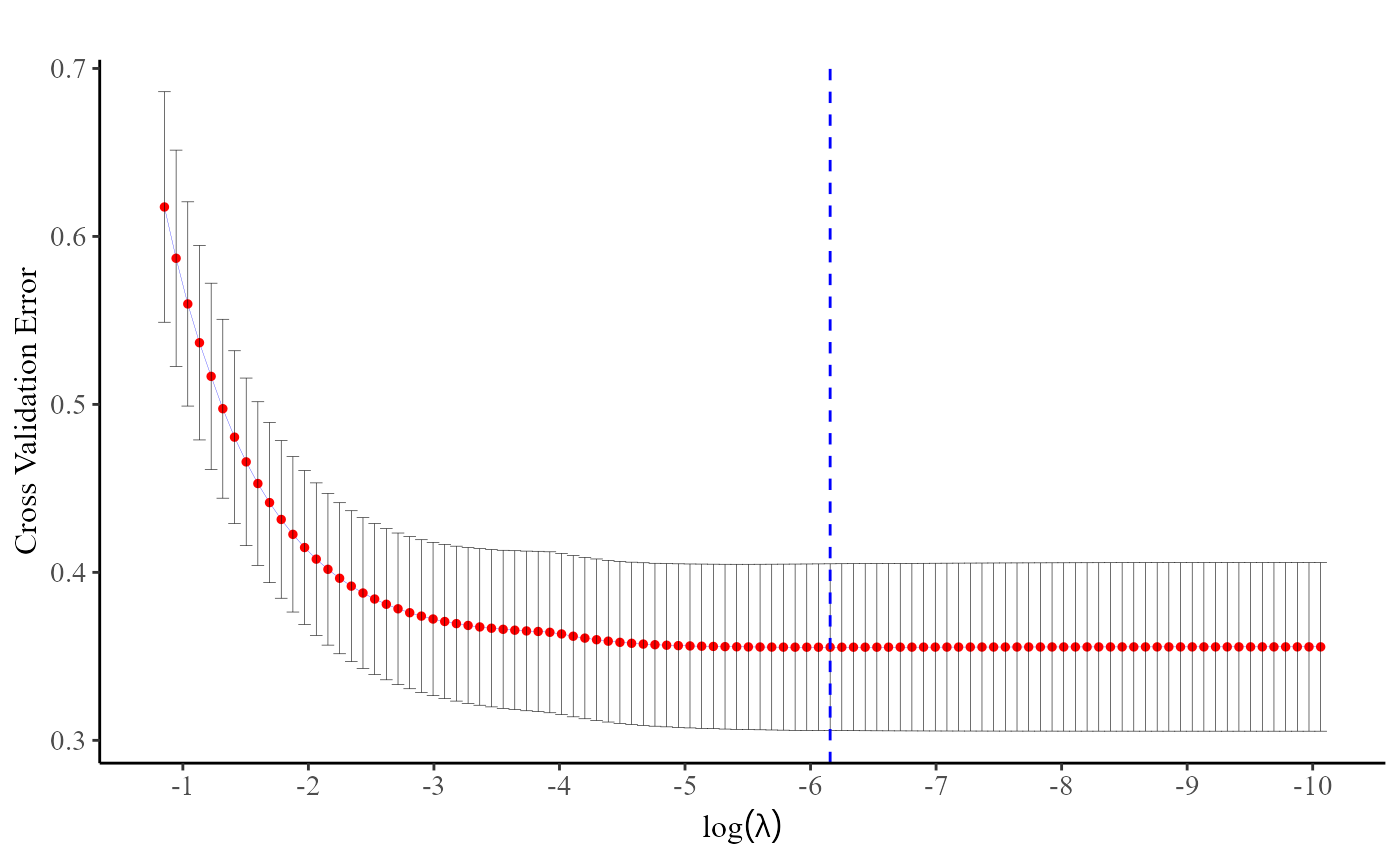
Plot the cross entropy loss from a cv.DiscSurv object
Source:R/plot.cve.Discsurv.R
plot.cv.DiscSurv.RdReturn the plot of the cross entropy loss from a cv.DiscSurv object
Usage
# S3 method for class 'cv.DiscSurv'
plot(
  fit,
  log.x = T,
  vertical.line = T,
  col.vertical.line = "blue",
  col.dot = "red"
)Examples
data(DiscTime)
data <- DiscTime$data
Event.char <- DiscTime$Event.char
Z.char <- DiscTime$Z.char
Time.char <- DiscTime$Time.char
cv.fit.DiscSurv <- cv.DiscSurv(data, Event.char, Z.char, Time.char, nfolds = 10)
plot(cv.fit.DiscSurv)