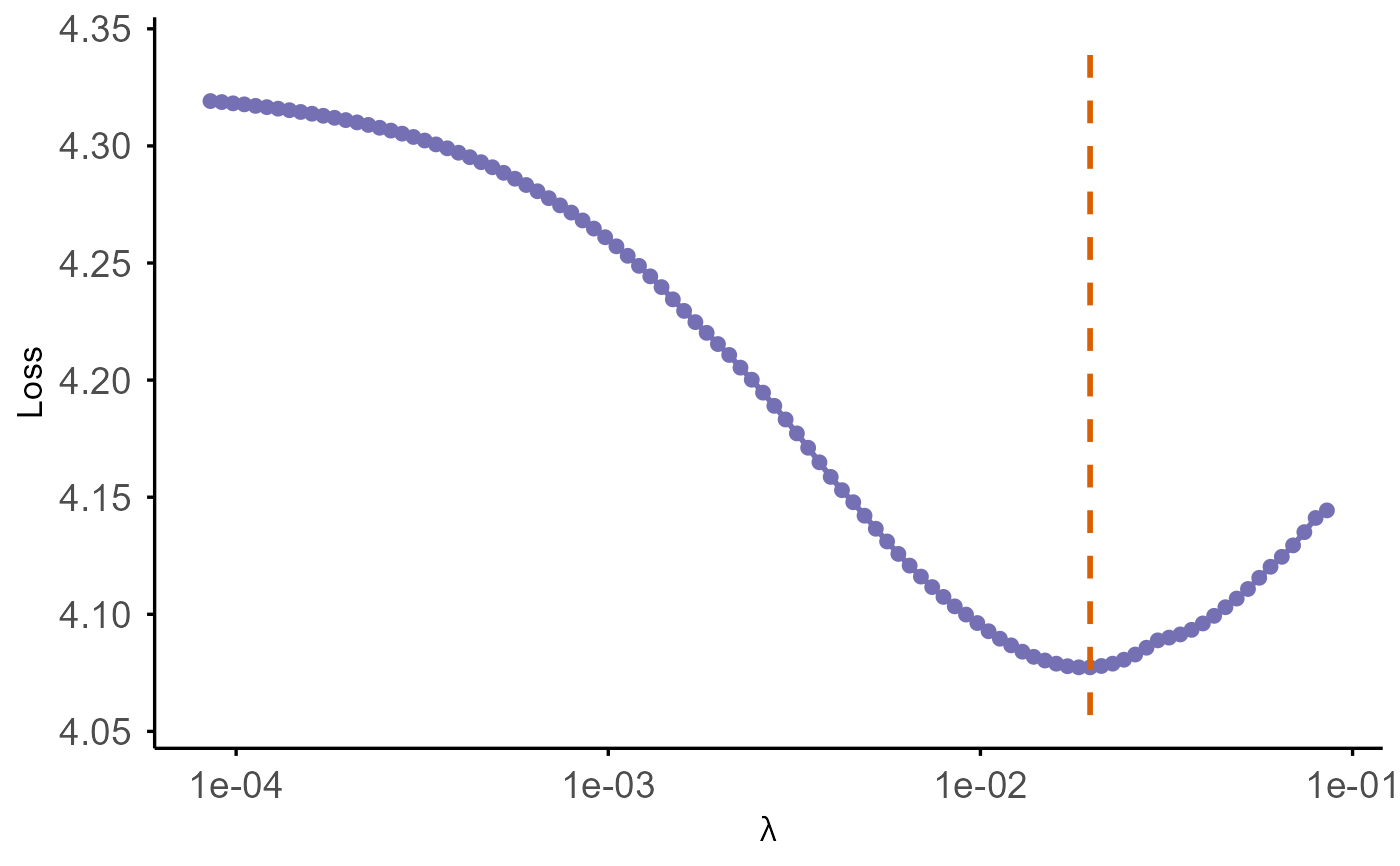
Plot Model Performance vs Lambda for coxkl_enet
plot.coxkl_enet.RdPlots model performance across the lambda sequence. Performance is
loss (-2 times partial log-likelihood) or concordance index (C-index).
If no test data are provided, the curve uses the training data stored in object$data.
Arguments
- object
A fitted model object of class
"coxkl_enet".- test_z
Optional numeric matrix of test covariates.
- test_time
Optional numeric vector of test survival times.
- test_delta
Optional numeric vector of test event indicators.
- test_stratum
Optional vector of test stratum membership.
- criteria
Character string:
"loss"or"CIndex".- ...
Additional arguments (ignored).
Details
When criteria = "loss" and no test data are supplied, the plotted values are
-2 * object$likelihood (no normalization). When test data are provided,
performance is computed via test_eval(..., criteria). The x-axis is shown
in decreasing lambda with a reversed log10 scale.
Examples
data(ExampleData_highdim)

train_dat_highdim <- ExampleData_highdim$train
test_dat_highdim <- ExampleData_highdim$test
beta_external_highdim <- ExampleData_highdim$beta_external

model_enet <- coxkl_enet(z = train_dat_highdim$z,
                         delta = train_dat_highdim$status,
                         time = train_dat_highdim$time,
                         beta = beta_external_highdim,
                         eta = 1,
                         alpha = 1.0)
plot(model_enet,
     test_z = test_dat_highdim$z,
     test_time = test_dat_highdim$time,
     test_delta = test_dat_highdim$status,
     test_stratum = test_dat_highdim$stratum,
     criteria = "loss")