Plot Model Performance vs Eta for coxkl
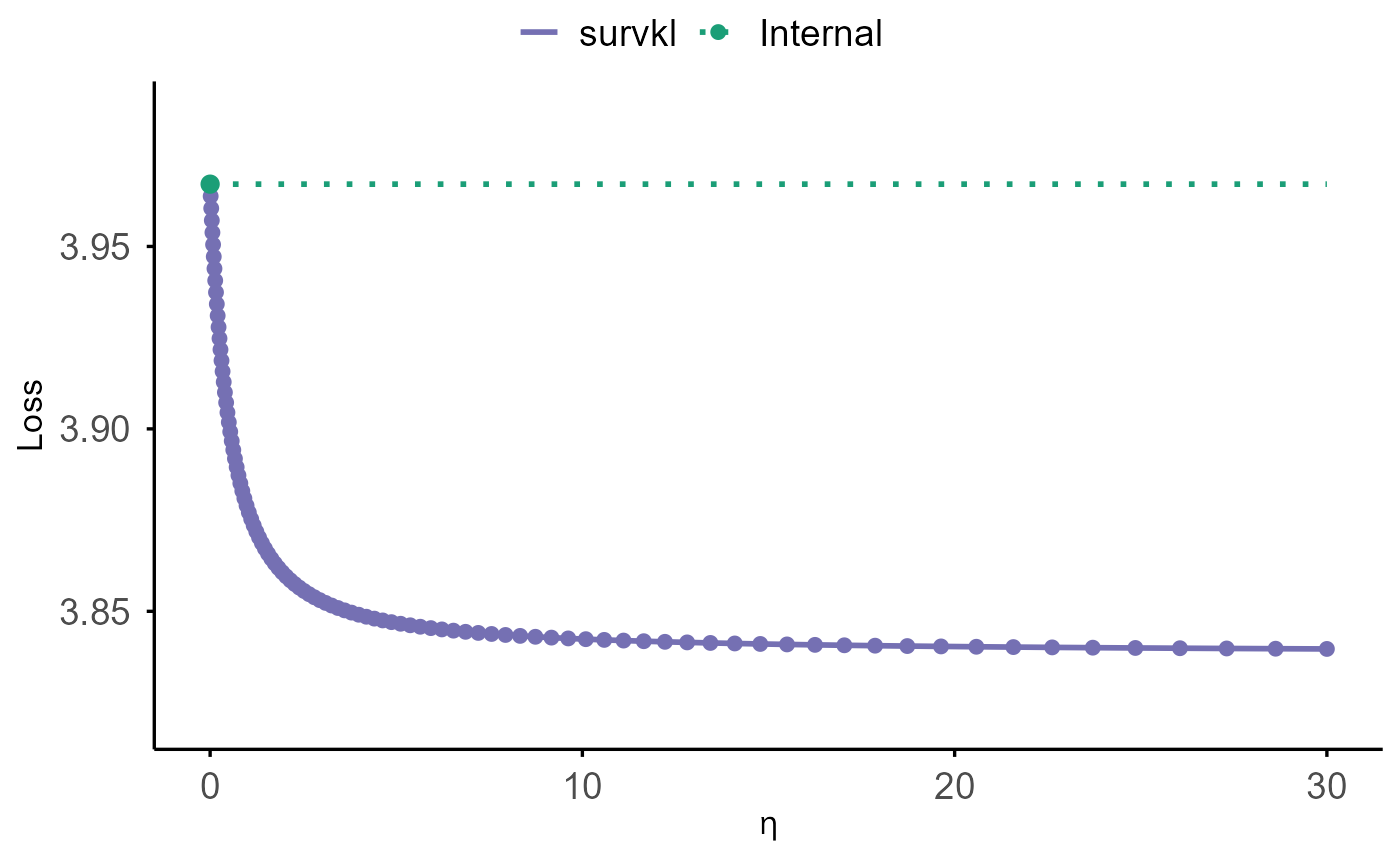
plot.coxkl.RdPlots model performance across the eta sequence. Performance is either
loss (-2 times partial log-likelihood) or concordance index (C-index).
If no test data are provided, the curve is computed on the training data stored
in object$data.
Arguments
- object
A fitted model object of class
"coxkl".- test_z
Optional numeric matrix of test covariates.
- test_time
Optional numeric vector of test survival times.
- test_delta
Optional numeric vector of test event indicators.
- test_stratum
Optional vector of test stratum membership.
- criteria
Character string:
"loss"or"CIndex".- ...
Additional arguments (ignored).
Details
When criteria = "loss" and no test data are supplied, the plotted values are
(-2 * object$likelihood) / n, where n is the number of rows in the
(training) data. When test data are provided, performance is computed via
test_eval(..., criteria = "loss") and divided by the test sample size.
For criteria = "CIndex", performance is computed via
test_eval(..., criteria = "CIndex") on the chosen dataset. The plot adds a
dotted horizontal reference line at the value corresponding to eta = 0
(closest point on the eta grid).
Examples
data(ExampleData_lowdim)

train_dat_lowdim  <- ExampleData_lowdim$train
test_dat_lowdim   <- ExampleData_lowdim$test
beta_external_good_lowdim <- ExampleData_lowdim$beta_external_good
eta_grid <- generate_eta(method = "exponential", n = 100, max_eta = 30)

model <- coxkl(z = train_dat_lowdim$z,
               delta = train_dat_lowdim$status,
               time = train_dat_lowdim$time,
               stratum = train_dat_lowdim$stratum,
               beta = beta_external_good_lowdim,
               etas = eta_grid)
plot(model,
     test_z = test_dat_lowdim$z,
     test_time = test_dat_lowdim$time,
     test_delta = test_dat_lowdim$status,
     test_stratum = test_dat_lowdim$stratum,
     criteria = "loss")
#> Warning: Using `size` aesthetic for lines was deprecated in ggplot2 3.4.0.
#> ℹ Please use `linewidth` instead.
#> ℹ The deprecated feature was likely used in the survkl package.
#>   Please report the issue to the authors.